
What each report measures
A precise definition of every number on the Analytics screen — what it counts, over what window, how current it is, and the limitation you need to know before you act on it.
- Who
- Anyone who needs the numbers behind the assistant
- Plan
- All plans
- Role
- Owner, Admin, Agent and Viewer can all open Analytics
Before you start
- At least one WhatsApp message or AI answer, otherwise the screen is empty
Analytics is the reports screen, under Analytics in the dashboard menu. Every figure on it is calculated from your own conversations, messages and AI records at the moment you load the page. This article defines each one exactly, because several of them are narrower than their label — and one of them is not your bill.
The time range
The header carries three links: 7 days, 30 days and 90 days. The default is 30 days, and the subtitle repeats the choice as Last N days. There is no custom start and end date, no comparison against a previous period, and no per-metric range — one range applies to the whole screen. If a page address carries any other value, the screen falls back to 30 days.
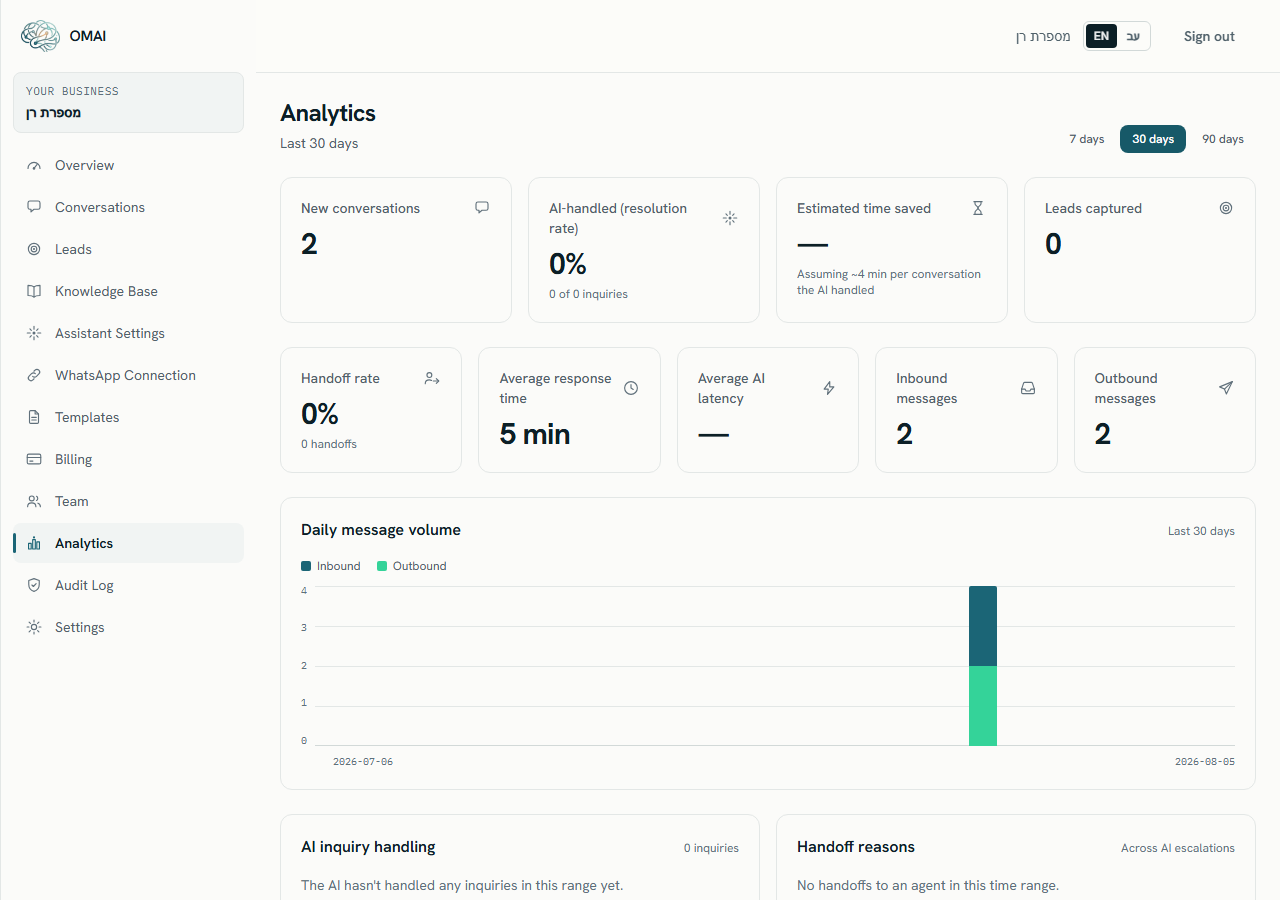
The headline numbers
| Tile | What it counts exactly | Known limitation |
|---|---|---|
| New conversations | Conversations that were created inside the range. | A conversation that started earlier and was busy all week is not counted here. |
| Inquiries the assistant replied to | Every AI outcome in which a reply was SENT — answered-with-a-source plus answered-without-a-source — divided by every AI outcome recorded in the range. The hint splits the two. | It is not a resolution rate and is no longer labelled as one: nothing records whether the customer’s problem was solved (the Resolved status on a conversation is only ever set by a person or by the history import). The divider also contains handovers and replies that were suppressed. |
| Estimated time saved | The count of replies the assistant sent, multiplied by an assumed number of minutes per conversation. The hint states the assumption used. | An assumption multiplied by a count. Nothing here is measured against real staff time. |
| Leads | Lead records the assistant captured inside the range. | Captured automatically from conversations that show real buying interest. Some enquiries may not be identified. See Leads. |
| Handoff rate | Handover outcomes divided by every AI outcome in the range. The hint gives the handover count. | Same divider as the replied-to percentage, so the two are directly comparable but neither is “of all conversations”. |
| Average response time | Per conversation, the gap between the newest incoming message and the newest message of any kind, averaged. Only conversations whose latest activity falls in the range are included, and only positive gaps. | This is not first-response time, and the newest message may be another incoming one. It is averaged over a sample of up to 1,000 conversations, not all of them. |
| Average AI latency | The mean time the AI took to produce an answer, shown in milliseconds under a second and in seconds above it. | Processing time only. It does not include how long WhatsApp took to deliver the message. |
| Inbound messages | Messages received from customers in the range. | Exact count. |
| Outbound messages | Messages sent in the range. | Exact count, and it mixes assistant replies, replies your team typed, and template messages. |
The panels
| Panel | What it shows | Known limitation |
|---|---|---|
| Daily message volume | One stacked bar per day: Inbound and Outbound message counts. Hovering a bar shows the two figures for that day. | Days are counted in UTC, not in your business time zone, so an Israeli day is shifted by 2–3 hours. The chart also draws one bar more than the range — 31 bars for 30 days — and the first bar covers a partial day that starts before the range. |
| AI inquiry handling | Four bars — Answered with a source, Answered without a source, Handed off, Suppressed — one for each way an AI turn ended. Answered without a source is a reply the assistant generated and sent when retrieval returned nothing usable from your knowledge base; it is not a clarifying question, and the assistant did not ask you or the customer anything. | The bars are drawn relative to the largest of the four, not as shares of the total, so bar length compares outcomes with each other, not with the whole. |
| Handoff reasons | A count for each reason a conversation went to a person: Low confidence, Customer angry, Agent requested, Sensitive topic, Out of scope, Professional advice, Retrieval failed, After hours, Manual handoff. | Handovers recorded without a reason are left out, so these can add up to less than the handover count on the Handoff rate tile. |
| Top questions | The 8 most repeated incoming messages, grouped by their exact text after case, punctuation and spacing are normalised. | Only literally repeated messages group. “What time do you open?” and “when are you open” stay two separate rows. It reads the 2,000 most recent incoming messages in the range and ignores anything shorter than 3 characters. |
| Unanswered questions | The same counter, restricted to conversations in which the assistant replied without a source or handed over at least once. | The filter is per conversation, not per message: every incoming message in such a conversation is counted, including the ones the assistant answered well. |
| Usage vs. plan quota | Four meters — AI replies, Inbound messages, Outbound messages, Template messages — each showing what was used against what the plan includes. The panel subtitle is your plan name, or No active plan. | The used figure covers the range you selected while the included figure is a monthly allowance, so the two are not comparable on 7 or 90 days. Metrics your plan sets no allowance for show ∞ and are drawn as a full red bar. |
| Estimated cost | Recorded provider costs for your account, grouped into WhatsApp messages, Meta templates, AI engine and Storage & indexing, with the total in the subtitle. | This is an estimate of what serving your account costs OMAI, priced from internal rates the code itself describes as illustrative. It is not an invoice and not a forecast of one. |
| Language breakdown | Conversations grouped by the language recorded on them: Hebrew, English, Mixed, Other. | Conversations whose language was never classified are dropped from the chart rather than shown as unknown. |
| After-hours inquiries | How many incoming messages arrived while your business was closed, judged against your weekly business hours. The panel is labelled Estimate. | It reads a sample of at most 2,000 messages, so the figure cannot go above 2,000 and is not a full count. Special closures are not applied — the panel says so. With no business hours set, it shows a prompt to set them instead. |
How current the data is
Every figure is computed while the page is being rendered, from live data, with no caching. That makes it as current as the moment you loaded the page — and it also means nothing updates on its own. There is no auto-refresh, no live tile and no refresh button: reload the page to recalculate.
There is also no export, no scheduled report, no emailed digest and no reporting API. What is on the screen is the whole of the reporting surface, and it is read-only.
When the screen is empty
If the range contains no conversations, no messages in either direction and no AI activity, the whole body is replaced by No data to show yet and a Go to conversations button. The range links stay, so you can widen the window and look again. Leads and cost records are not part of that test, so an account with those but no messages still sees the empty state.
Individual panels have their own empty wording: The AI hasn’t handled any inquiries in this range yet., No handoffs to an agent in this time range., Not enough inbound messages to analyze., No open questions — nice work!, No costs recorded in this range. and No language data yet.
What the reports cannot tell you
- First-response time. The Average response time tile measures a different gap, described above.
- Per-agent or per-number breakdowns. Nothing on the screen splits by team member or by connected number.
- Revenue, conversion or return. No sales figure is recorded anywhere in OMAI, so none can be reported.
- Churn, retention or chargebacks. These are not recorded, and no report reconstructs them.
- Unique visitors or unique customers. Every count is of records — conversations, messages, outcomes.
- Any drill-down. No tile or bar is clickable, and no panel opens the underlying conversations.
Why does the volume chart show 31 bars for a 30-day range?
The series is built inclusively from the first day to the last, which produces one extra bucket. The first bar begins at the UTC midnight before your range starts, so it holds a partial day.
The replied-to percentage looks high, but customers complain. What else should I look at?
Read the tile’s own split first: a high percentage made mostly of Answered without a source means the assistant is replying with nothing from your knowledge base behind it, which is the shape complaints come from. Then read Handoff reasons and Unanswered questions together — recurring unanswered wording usually means the source material is thin. Retrieval — how answers are found covers what to add.
Can I get this as a CSV or a monthly email?
No. There is no export and no scheduled report anywhere in the product. Conversation data can be exported separately — see Exporting conversations.
The whole page shows a generic error instead of the reports.
Analytics is included on every plan, but it is switched off while a subscription has not completed checkout or payment, and while a deletion request is being processed. In those states the page fails with a general error rather than a specific message. Check the subscription state on the billing page.